
01 / The challenge
The team was already using AI coding agents, but the workflow required substantial debugging, monitoring, routine question answering and manual coordination.
Each additional work stream created supervision, dependency and integration overhead. The objective was to increase accepted output without increasing human supervision at the same rate.
02 / The system
A defined route from agreed work to accepted changes.
- Agreed work
- Separate task workspace
- Verification
- Queued integration
- Accepted shared change
| Coordination | How the harness handles it |
|---|---|
| Give each task a controlled workspace. | Check dependencies and available capacity before starting independent work in parallel. |
| Keep stalled work moving. | Prompt agents to continue or seek another technical opinion; pass decisions requiring human judgement or approval to the operator. |
| Coordinate integration. | Bring finished changes through a queue and check them against the latest shared version before acceptance. |
| Route conflicts appropriately. | Resolve simple, predictable conflicts automatically. Return program-logic conflicts for agent repair and verification. |
03 / Observed results
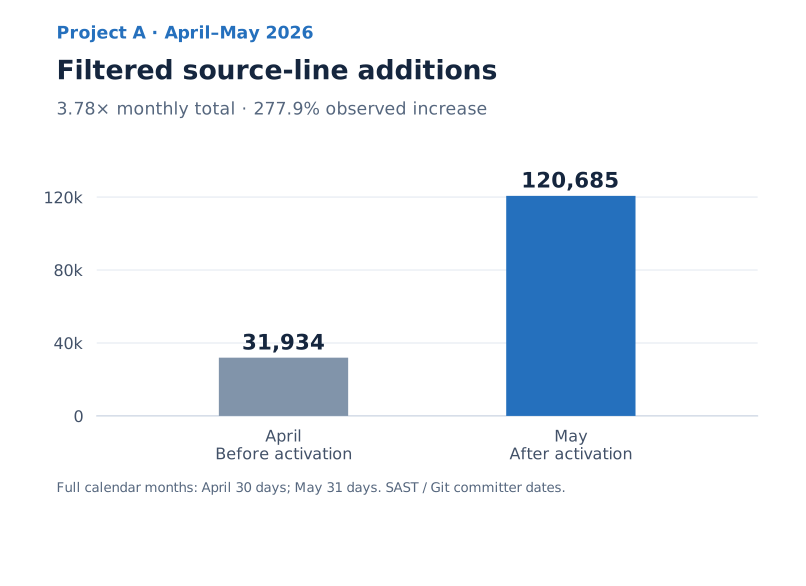
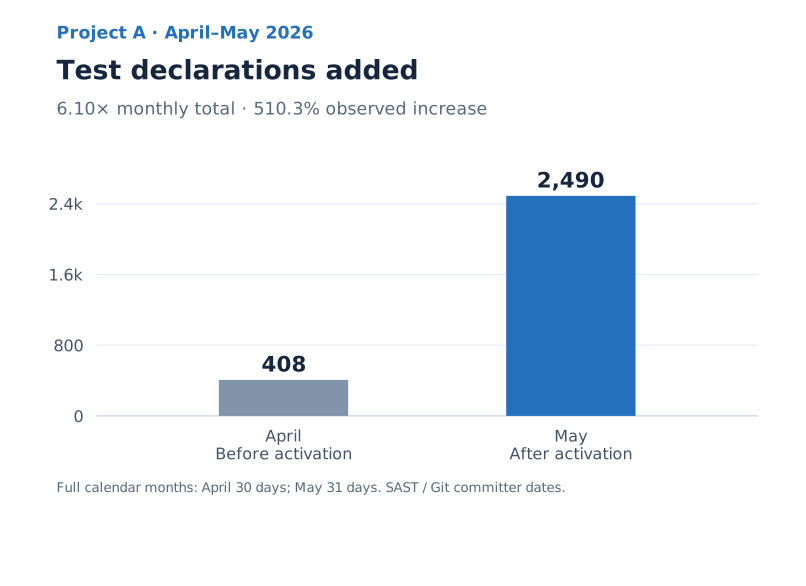
More source additions and test material entered accepted history.
The report used accepted Git history, GitLab merge records and recorded task intervals to describe repository output and how work overlapped. April was before the workflow activation and May was after. Staffing and development practices stayed constant, while workload, models and model performance varied. The counts therefore show activity in the repository around that change; they do not isolate its effect.
Merged requests vs Graphite's industry median
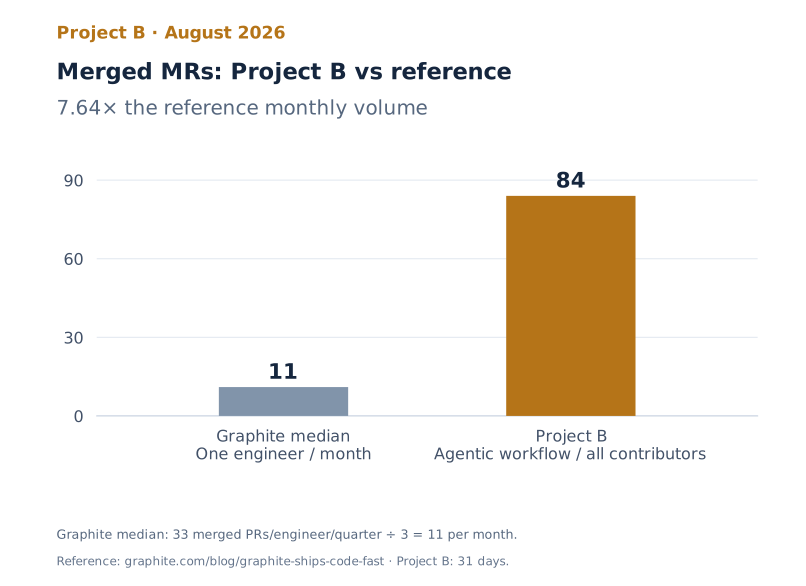
Source: Graphite's industry-median analysis · Selected month, August 2026.
Open full-size chartSource additions vs a historical Facebook study
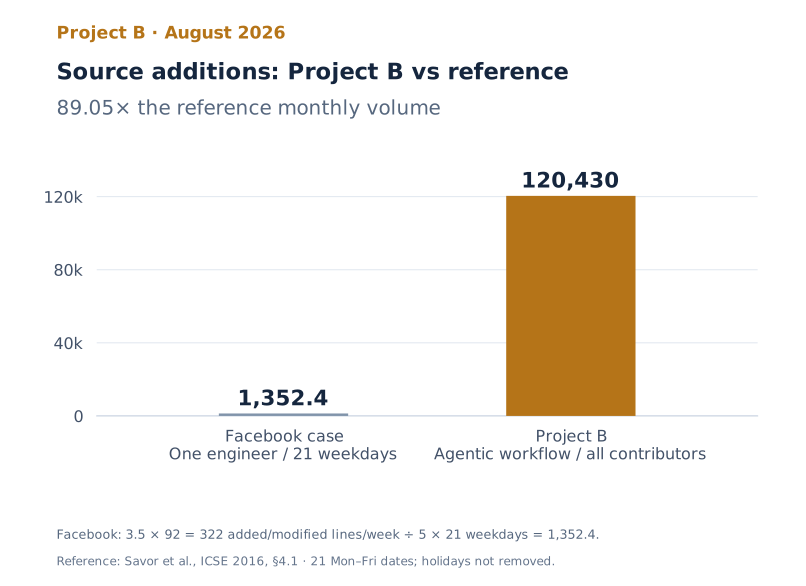
Source: Continuous Deployment at Facebook and OANDA (2016), §4.1
Open full-size chart04 / Parallel work
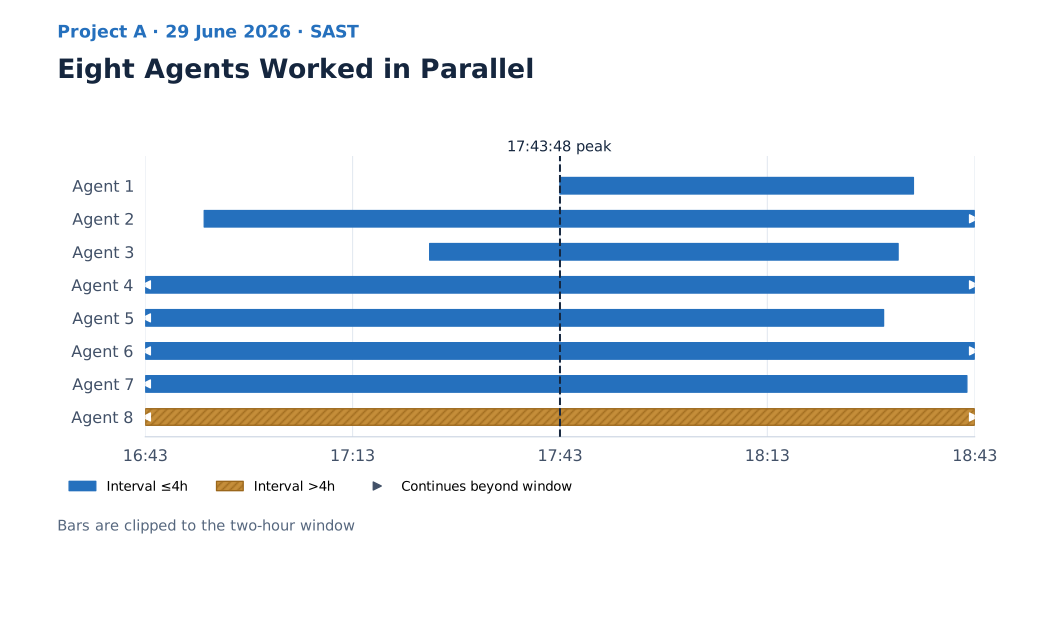
Eight agents, one controlled project.
On 29 June 2026, eight agents were recorded executing or verifying unique tasks concurrently in Project A on an individual engineer’s development environment.
From setup to first accepted contribution
A separate onboarding observation looked at first contribution rather than repository output. One developer with limited familiarity reported two days from device setup to a first accepted bug fix. They described previous team onboarding as roughly one week to three months, depending on experience. This is one self-reported example and an early adoption signal, not a measured comparison across developers.
05 / Reading the evidence
The assessment reviewed accepted Git history, GitLab merge records, recorded task-stage intervals and operator feedback.
Source figures count code added to selected source files and exclude other file types, directories and known generated packages.
The team reports greater reliability, less debugging and monitoring, and fewer human interventions.
06 / Next measures
Measure accepted work per unit of human attention.
| Outcome | What to measure |
|---|---|
| Delivery capacity | Accepted changes per human hour and elapsed day, including dependency, review and integration waiting time. |
| Reliability | Rework time per accepted change and post-release defects. |
| Coordination effort | Human interventions, monitoring time and conflict-repair time per task. |
| Economics | Model, infrastructure and human cost per accepted change. |
About this study
Based on the company’s Scaling AI-Assisted Software Delivery report. Evidence covers two anonymised repositories through 4 October 2026 and combines repository records, recorded task-stage intervals and operator accounts.